Embark on a journey to understand Site Reliability Engineering (SRE), a discipline that marries software engineering principles with operational practices. This approach aims to build highly reliable and scalable systems. It’s about ensuring that your applications are not just functional but also resilient, efficient, and capable of handling the demands of your users. SRE is fundamentally about applying engineering rigor to the operations side of the house.
This comprehensive guide will explore the core tenets of SRE, delving into its principles, practices, and the crucial role it plays in modern software development. We’ll uncover the key responsibilities of an SRE, explore critical concepts like error budgets and SLOs, and examine how automation, monitoring, and incident management contribute to a robust and dependable system. From capacity planning to release engineering, we’ll cover the spectrum of topics essential to understanding and implementing SRE successfully.
This will also explore the difference between SRE and traditional IT operations, offering a clearer view of its advantages.
Definition and Core Principles of SRE
Site Reliability Engineering (SRE) represents a discipline that applies software engineering principles to infrastructure and operations challenges. It is a holistic approach to managing and improving the reliability, performance, and scalability of systems and services. SRE teams work to ensure that services are available, responsive, and meet the needs of their users.
Defining Site Reliability Engineering
SRE can be defined as a set of practices that treats operations as a software problem. It utilizes software engineering tools and methodologies to automate tasks, monitor systems, and proactively address potential issues. This approach aims to create highly reliable and scalable systems. It is not merely about fixing problems; it is about building systems that are designed to be reliable from the outset.
Core Principles of SRE
The core principles of SRE provide a framework for building and maintaining reliable systems. Adherence to these principles allows teams to manage complexity, automate tasks, and improve service performance.
- Embrace Automation: Automation is a cornerstone of SRE. Automating repetitive tasks, such as deployments, monitoring, and incident response, frees up engineers to focus on more strategic work and reduces the risk of human error. For example, Google uses automation extensively to manage its vast infrastructure. They automate everything from code deployments to capacity planning, ensuring that engineers can focus on improving the system rather than performing manual tasks.
- Monitoring and Alerting: Comprehensive monitoring is essential for understanding system behavior and identifying potential problems. SRE teams establish robust monitoring systems that track key metrics, such as latency, error rates, and traffic volume. Alerts are configured to notify engineers when predefined thresholds are exceeded, allowing for proactive intervention.
- Incident Response: A well-defined incident response process is crucial for quickly resolving outages and minimizing their impact. This includes clear escalation procedures, communication protocols, and post-incident reviews to identify root causes and prevent future occurrences.
- Blameless Postmortems: After an incident, a blameless postmortem is conducted. This involves a detailed analysis of the incident, focusing on the system failures and the actions taken, rather than assigning blame to individuals. The goal is to learn from the incident and implement improvements to prevent similar issues in the future.
- Service Level Objectives (SLOs) and Error Budgets: SLOs define the target level of service performance, such as availability or latency. Error budgets are then established based on these SLOs. If the service performs better than the SLO, the team can take more risks and implement new features. If the service performs worse, the team prioritizes reliability over new features.
SRE and DevOps: A Relationship
SRE and DevOps share a common goal: to improve the speed and reliability of software delivery. They are closely related, with SRE often viewed as a practical implementation of DevOps principles. DevOps focuses on breaking down silos between development and operations teams, while SRE provides a concrete framework for achieving this goal.
- Shared Principles: Both SRE and DevOps emphasize automation, collaboration, and continuous improvement. They both advocate for a culture of shared responsibility and a focus on the entire lifecycle of a service.
- SRE as an Implementation: SRE can be seen as a specific implementation of DevOps principles, providing a set of practices and tools for managing the operational aspects of software development. It offers a practical approach to implementing the cultural and philosophical ideas of DevOps.
- Collaboration: Successful SRE requires close collaboration between development and operations teams. Developers contribute to the operational aspects of their code, and operations engineers use software engineering principles to manage infrastructure and systems.
Prioritizing Service Availability, Latency, Performance, and Capacity
SRE teams are responsible for ensuring that services are available, responsive, and capable of handling user demand. They achieve this by focusing on several key areas:
- Availability: Availability refers to the percentage of time a service is operational and accessible to users. SRE teams use techniques such as redundancy, failover mechanisms, and automated recovery to ensure high availability. For instance, a web server might be configured with multiple instances, so if one fails, traffic is automatically routed to the others.
- Latency: Latency is the time it takes for a service to respond to a request. SRE teams work to minimize latency by optimizing code, improving network performance, and caching frequently accessed data.
- Performance: Performance encompasses the overall speed and efficiency of a service. This includes factors such as throughput (the amount of work a service can handle) and resource utilization (how efficiently resources like CPU and memory are used).
- Capacity: Capacity refers to the ability of a service to handle increasing user demand. SRE teams plan for capacity by monitoring resource usage, predicting future needs, and scaling infrastructure as necessary.
The Role of an SRE
Site Reliability Engineers (SREs) are the linchpin of modern software development and deployment, responsible for ensuring the reliability, performance, and scalability of critical systems. They bridge the gap between development and operations, applying software engineering principles to solve operational problems. This role is multifaceted, demanding a unique blend of technical expertise, problem-solving abilities, and a collaborative spirit.
Key Responsibilities of a Site Reliability Engineer
SREs are tasked with a wide range of responsibilities that directly impact the health and performance of a system. These responsibilities are crucial for maintaining a positive user experience and minimizing downtime.
- Monitoring and Alerting: SREs establish comprehensive monitoring systems to track the health and performance of applications and infrastructure. They define key performance indicators (KPIs) and set up alerting systems to notify the appropriate teams when issues arise. For example, an SRE might monitor CPU usage, latency, and error rates, setting alerts to trigger when these metrics exceed predefined thresholds.
- Incident Response and Management: When incidents occur, SREs are at the forefront of the response. They lead the troubleshooting process, coordinating with other teams to diagnose and resolve issues quickly. This includes on-call rotations and the use of incident management tools.
- Performance Optimization: SREs proactively identify and address performance bottlenecks within the system. They utilize profiling tools, analyze logs, and collaborate with developers to optimize code, database queries, and infrastructure configurations.
- Capacity Planning: Anticipating future needs is crucial for system stability. SREs forecast resource requirements based on historical data and growth projections, ensuring that the infrastructure can handle increased loads. This may involve scaling up existing resources or implementing auto-scaling solutions.
- Automation and Tooling: A core tenet of SRE is automation. SREs automate repetitive tasks, such as deployments, configuration management, and system maintenance, using scripting languages and infrastructure-as-code tools. This reduces manual effort and improves efficiency.
- Error Budget Management: SREs work with development teams to define and manage error budgets. An error budget represents the acceptable level of unreliability. This framework helps balance the need for new feature releases with the importance of system stability. If the system exceeds the error budget, development teams may prioritize stability over new features.
Skills and Experience Required for an SRE Role
The SRE role demands a specific skill set, blending software engineering principles with operational expertise. Candidates typically possess a strong foundation in computer science or a related field, along with practical experience in managing and maintaining complex systems.
- Strong Programming Skills: Proficiency in at least one scripting language (e.g., Python, Go, or Ruby) is essential for automating tasks, writing monitoring scripts, and developing tools.
- Operating System Knowledge: A deep understanding of operating systems (Linux is particularly important) is necessary for troubleshooting issues, configuring servers, and understanding system behavior.
- Networking Fundamentals: Knowledge of networking concepts, including TCP/IP, DNS, and load balancing, is crucial for diagnosing network-related problems.
- Cloud Computing Experience: Familiarity with cloud platforms (e.g., AWS, Google Cloud, or Azure) and related services is increasingly important, as many organizations are migrating to the cloud.
- Monitoring and Alerting Tools: Experience with monitoring tools (e.g., Prometheus, Grafana, or Datadog) and alerting systems is critical for proactively identifying and responding to issues.
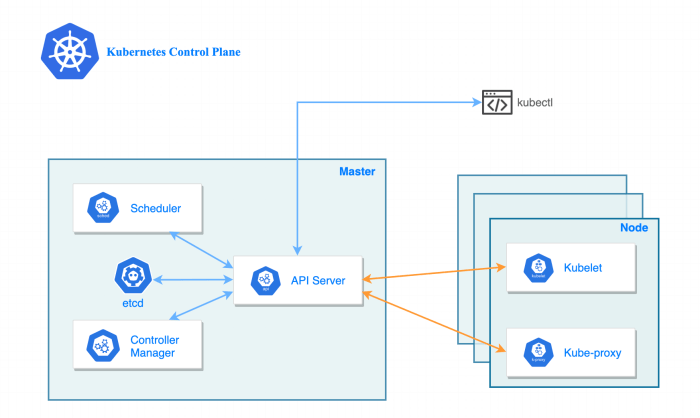
- Containerization and Orchestration: Knowledge of containerization technologies (e.g., Docker, Kubernetes) and orchestration platforms is valuable for managing and scaling applications.
- Database Management: Understanding of database concepts, including relational and NoSQL databases, is helpful for troubleshooting database-related issues.
- Problem-Solving and Analytical Skills: SREs must be able to analyze complex problems, identify root causes, and implement effective solutions.
- Communication and Collaboration Skills: Effective communication and the ability to work collaboratively with development and operations teams are essential for success.
Interaction with Development and Operations Teams
SREs act as a crucial bridge between development and operations teams, fostering collaboration and shared responsibility. This interaction is key to achieving the goals of reliability, performance, and scalability.
- Collaboration with Development Teams: SREs work closely with development teams to ensure that new features and code changes are designed and implemented with reliability in mind. This includes providing feedback on design, conducting performance tests, and participating in code reviews.
- Shared Ownership of Production Systems: SREs share ownership of production systems with both development and operations teams. This shared responsibility helps ensure that everyone is invested in the success of the system.
- Feedback Loops and Continuous Improvement: SREs provide feedback to development teams on the performance and reliability of their code. They use this feedback to drive continuous improvement in both the development and operational processes.
- Tools and Automation for Developers: SREs build tools and automate processes to make it easier for developers to deploy and manage their code. This includes tools for continuous integration and continuous delivery (CI/CD).
- Collaboration with Operations Teams: SREs collaborate with operations teams to ensure that the infrastructure is properly configured and maintained. They work together to troubleshoot issues, implement security measures, and optimize performance.
Typical Tasks Performed by an SRE
The day-to-day activities of an SRE are varied, reflecting the diverse responsibilities of the role. These tasks are aimed at maintaining system stability, improving performance, and automating operational processes.
- Responding to Incidents: Investigating and resolving system outages and performance issues. This involves troubleshooting, coordinating with other teams, and implementing fixes.
- Monitoring System Health: Continuously monitoring system performance using monitoring tools, analyzing metrics, and setting up alerts.
- Automating Deployments: Automating the deployment process to reduce manual effort and improve efficiency. This includes creating and maintaining deployment pipelines.
- Performance Tuning: Identifying and resolving performance bottlenecks, such as slow database queries or inefficient code.
- Capacity Planning: Forecasting resource requirements and scaling the infrastructure to meet demand.
- Creating Runbooks and Documentation: Documenting operational procedures and creating runbooks to ensure that issues can be resolved quickly and efficiently.
- Participating in On-Call Rotations: Being on-call to respond to incidents outside of regular business hours.
- Developing and Maintaining Tools: Building and maintaining tools to automate tasks and improve system reliability.
- Conducting Post-Incident Reviews: Analyzing incidents to identify root causes and prevent future occurrences.
Error Budgets and SLOs/SLIs
Service Level Objectives (SLOs) and Service Level Indicators (SLIs), coupled with error budgets, are crucial components of a robust SRE practice. They provide a framework for measuring and managing service reliability, balancing the need for stability with the desire for innovation and feature releases. This section will delve into the specifics of these concepts, demonstrating how they are implemented and used effectively.
Error Budgets and Their Significance
An error budget is a predefined allowance of acceptable unreliability for a service over a specific period, typically a month or a quarter. It quantifies the amount of “bad” behavior, such as errors or downtime, that a service can experience before triggering a need for immediate action. The core idea is to provide a safety margin, or budget, for engineers to make changes and deploy new features.
The error budget is calculated based on the Service Level Objective (SLO).
For instance, if an SLO dictates that a service should be available 99.9% of the time, the remaining 0.1% represents the error budget. This budget is a crucial metric because:
- It aligns engineering teams with business goals by providing a clear measure of acceptable service quality.
- It encourages a proactive approach to reliability, prompting teams to prioritize improvements before the budget is exhausted.
- It helps balance the need for innovation with the need for stability. When the error budget is ample, teams can take more risks; when it’s low, they must focus on stability.
Service Level Objectives (SLOs) and Service Level Indicators (SLIs)
SLOs and SLIs are fundamental to SRE. SLOs define the target level of service performance, while SLIs are the metrics used to measure that performance. The process starts with identifying key customer journeys or critical user actions. Then, the SLIs measure the performance of these actions. Finally, the SLOs set the targets for these measurements.
Examples of common SLOs and SLIs:
- SLI: Request Latency (e.g., time to respond to a user request).
- SLO: 99% of requests are served within 300ms.
- SLI: Error Rate (e.g., percentage of failed requests).
- SLO: Error rate should be less than 1% of all requests.
- SLI: Availability (e.g., percentage of time the service is available).
- SLO: The service should be available 99.9% of the time.
Utilizing Error Budgets for Risk Management and Innovation
Error budgets act as a key indicator for the pace of change. When the error budget is largely intact, teams have more leeway to experiment with new features and deployments. Conversely, when the error budget is being rapidly consumed, the focus shifts to stabilizing the service and reducing errors. This is a dynamic process that can be visualized in the following way:
Imagine a scenario where a service has a monthly error budget equivalent to 1% of downtime.
- Scenario 1: Budget largely intact. The service has been performing well, and the error rate is low. The SRE team might decide to release a new feature or perform a more significant infrastructure change, knowing that they have room for some errors without exceeding the budget.
- Scenario 2: Budget being consumed. A recent deployment has introduced a performance issue, and the error rate is increasing. The SRE team immediately prioritizes fixing the issue. They might roll back the change, implement temporary mitigations, and postpone less critical deployments until the service is stable.
This process is similar to how financial budgets work. If a company is under budget in one area, it may have the flexibility to invest more in another area. If it is over budget, it must make cuts.
Establishing and Monitoring SLOs: A Process
Establishing and monitoring SLOs involves several steps. These steps must be followed to make sure that the services run smoothly.
- Define the Service: Clearly identify the service and its critical functions. What are the core features that users rely on?
- Identify Key User Journeys: Determine the most important interactions users have with the service. These journeys will form the basis for SLIs.
- Select SLIs: Choose metrics that accurately reflect the user experience. Common SLIs include latency, error rate, and availability.
- Set SLOs: Define target levels for each SLI. These should be ambitious yet achievable, balancing the need for high reliability with the desire for innovation.
- Implement Monitoring and Alerting: Set up systems to collect data for SLIs and trigger alerts when SLOs are at risk.
- Regular Review and Adjustment: Regularly review SLOs and SLIs to ensure they remain relevant and effective. Adjust as needed based on changing user needs, business goals, and service performance.
An example of this process in action might be an e-commerce platform:
- Service: The product catalog service.
- Key User Journey: Viewing product details.
- SLI: The time it takes to load a product detail page.
- SLO: 99% of product detail pages load within 2 seconds.
- Monitoring: Implement monitoring to track page load times. Set up alerts to notify the SRE team if the average load time exceeds 2 seconds.
- Review: Review the SLO quarterly, adjusting it based on performance data and business priorities. If the platform is experiencing significant growth, the SLO might be adjusted to accommodate increased traffic.
Monitoring and Alerting in SRE
Monitoring and alerting are critical pillars of Site Reliability Engineering, enabling proactive identification and resolution of issues before they impact users. Effective monitoring provides real-time insights into system behavior, allowing SREs to understand performance, detect anomalies, and ensure the reliability and availability of services. Alerting, the automated notification system, then acts upon these insights, informing the relevant teams of potential problems and triggering the necessary response to maintain service levels.
Significance of Monitoring in an SRE Context
Monitoring is essential for understanding the health and performance of a system, aligning directly with SRE’s core principles of reliability, availability, and performance. It provides the data necessary to make informed decisions, identify bottlenecks, and optimize system resources. This continuous observation allows SREs to proactively address issues, minimize downtime, and improve the overall user experience.
- Proactive Issue Detection: Monitoring systems constantly collect data on various metrics, enabling the early identification of potential problems before they escalate into major incidents. This includes detecting performance degradation, resource exhaustion, and other anomalies.
- Performance Optimization: By analyzing monitoring data, SREs can identify areas for optimization, such as inefficient code, poorly configured infrastructure, or resource allocation imbalances. This leads to improved performance and efficiency.
- Incident Response and Management: Monitoring provides crucial data during incidents, helping SREs understand the root cause of the problem, assess its impact, and implement effective solutions. The data helps to diagnose the problem quickly.
- Capacity Planning: Monitoring provides insights into resource usage trends, allowing SREs to forecast future needs and proactively scale infrastructure to meet demand.
- SLO Compliance: Monitoring data is used to track Service Level Objective (SLO) performance. It helps ensure services meet the defined levels of reliability and availability.
Comparison of Monitoring Tools and Functionalities
Several monitoring tools are available, each with its strengths and weaknesses. The choice of tools depends on the specific needs of the organization, the complexity of the infrastructure, and the desired level of detail. Some popular categories include:
- Infrastructure Monitoring Tools: These tools focus on monitoring the underlying infrastructure, including servers, networks, and storage. Examples include:
- Prometheus: An open-source monitoring system and time-series database. It is particularly well-suited for containerized environments and cloud-native applications. Prometheus uses a pull-based model for data collection, making it easy to scale and manage. It’s known for its powerful query language (PromQL) and integration with other tools like Grafana.
- Nagios: A widely used open-source monitoring system for monitoring systems, networks, and infrastructure. Nagios offers a robust set of features, including host and service monitoring, alerting, and reporting. It is known for its flexibility and extensibility.
- Zabbix: An open-source monitoring tool that monitors networks, servers, and applications. Zabbix offers a user-friendly interface, a wide range of monitoring capabilities, and advanced features like predictive analytics.
- Application Performance Monitoring (APM) Tools: These tools provide detailed insights into the performance of applications, including code-level diagnostics, transaction tracing, and user experience monitoring. Examples include:
- New Relic: A comprehensive APM platform that provides real-time insights into application performance, user experience, and infrastructure health. It offers features like transaction tracing, error analysis, and custom dashboards.
- Datadog: A monitoring and analytics platform that provides full-stack observability. Datadog integrates with various technologies and offers features like APM, infrastructure monitoring, log management, and security monitoring.
- Dynatrace: An AI-powered APM platform that automatically discovers and monitors applications, infrastructure, and user experience. It offers features like real-time performance monitoring, anomaly detection, and root cause analysis.
- Log Management Tools: These tools collect, store, and analyze log data from various sources, providing insights into system behavior and helping to identify and troubleshoot issues. Examples include:
- Elasticsearch, Logstash, and Kibana (ELK Stack): A popular open-source log management platform. Elasticsearch is a search and analytics engine, Logstash is a data processing pipeline, and Kibana is a data visualization tool.
- Splunk: A powerful log management and security information and event management (SIEM) platform. Splunk offers features like log collection, indexing, searching, analysis, and reporting.
- Sumo Logic: A cloud-based log management and analytics platform. Sumo Logic provides features like log collection, real-time analytics, and security monitoring.
Creating a System for Effective Alerting Based on SLOs
Effective alerting is crucial for SREs to respond quickly to incidents and maintain service levels. Alerting systems should be directly tied to SLOs, ensuring that alerts are triggered when service performance deviates from the agreed-upon targets.
- Define Alerting Thresholds: Based on SLOs and SLIs, establish clear thresholds for triggering alerts. These thresholds should be based on the acceptable error rate or performance degradation. For example, if an SLO defines an error budget of 99.9%, an alert could be triggered when the error rate exceeds 0.1% over a specific time window (e.g., 5 minutes).
- Choose the Right Metrics: Select the most relevant metrics (SLIs) to monitor and alert on. For example, if the SLO is focused on latency, the alert should be triggered when the average response time exceeds a certain threshold.
- Implement Alerting Rules: Configure the monitoring system to trigger alerts when the defined thresholds are breached. This involves setting up rules that evaluate the metrics and trigger notifications when necessary.
- Prioritize Alerts: Categorize alerts based on their severity and impact on the service. Critical alerts should be escalated immediately, while less critical alerts can be addressed with a lower priority.
- Integrate with Notification Channels: Integrate the alerting system with appropriate notification channels, such as email, Slack, PagerDuty, or other incident management tools. Ensure that the right teams and individuals are notified based on the alert’s priority and impact.
- Example Alerting Scenario: Consider a service with an SLO of 99.9% availability, and an SLI measuring the percentage of successful requests. An alerting rule could be configured to trigger an alert if the error rate exceeds 0.1% within a 5-minute window. This would notify the on-call SRE team to investigate and resolve the issue before the SLO is breached.
Detailing Best Practices for Incident Response and Management
Effective incident response and management are critical for minimizing the impact of incidents and restoring services quickly. Following a structured approach and established best practices is essential.
- Establish an Incident Response Plan: Develop a documented incident response plan that Artikels the roles and responsibilities of the SRE team, the escalation procedures, and the communication protocols. The plan should be readily available and regularly reviewed and updated.
- Detect and Acknowledge Incidents: The monitoring and alerting systems should immediately detect and notify the on-call SRE team of any incident. The team must acknowledge the alert and begin the investigation promptly.
- Assess the Impact: Determine the scope and severity of the incident. Identify the affected services, the number of users impacted, and the potential business impact.
- Investigate and Diagnose: Use monitoring tools, logs, and other data to identify the root cause of the incident. Collaborate with other teams, as needed, to gather information and analyze the issue.
- Implement a Solution: Once the root cause is identified, implement a solution to resolve the incident. This may involve rolling back a recent change, applying a fix, or scaling up resources.
- Communicate: Communicate the incident status to stakeholders, including users, management, and other relevant teams. Provide regular updates on the progress of the investigation and the expected resolution time.
- Document the Incident: Document the incident, including the timeline of events, the root cause, the actions taken to resolve the incident, and the lessons learned. This documentation is essential for post-incident reviews and for preventing similar incidents in the future.
- Conduct a Post-Incident Review: After the incident is resolved, conduct a post-incident review to analyze the incident, identify areas for improvement, and update the incident response plan. The review should focus on identifying the root cause, the impact, the effectiveness of the response, and any preventive measures.
- Example Incident Response Scenario: Suppose a critical service experiences a sudden increase in latency, and users begin reporting errors. The monitoring system detects the increased latency and triggers an alert. The on-call SRE team acknowledges the alert and begins investigating. They examine the application logs, infrastructure metrics, and network performance to identify the root cause. They determine that a recent code deployment introduced a performance bottleneck.
The team rolls back the deployment, which resolves the latency issue. They then document the incident, conduct a post-incident review, and implement a fix for the code issue.
Automation and Infrastructure as Code
Automation and Infrastructure as Code (IaC) are fundamental pillars of SRE, enabling efficiency, scalability, and reliability in modern software development and operations. They allow SRE teams to manage complex systems effectively, reduce manual effort, and ensure consistency across environments. This section delves into the role of automation, the practical applications of IaC, and the design of automated deployment and rollback processes, culminating in a table of useful automation tools.
The Role of Automation in SRE Practices
Automation is a cornerstone of SRE, empowering teams to manage complex systems efficiently and consistently. It shifts the focus from reactive troubleshooting to proactive problem-solving, leading to increased reliability and reduced operational overhead. Automation enables SREs to scale operations, manage infrastructure effectively, and reduce human error.
Examples of Infrastructure as Code Usage
Infrastructure as Code (IaC) is the practice of managing and provisioning infrastructure through code, rather than manual processes. This approach allows for version control, repeatability, and automation of infrastructure tasks.
- Provisioning Servers and VMs: IaC tools can define and deploy virtual machines or servers across various cloud providers (AWS, Azure, GCP) or on-premise environments. For instance, using Terraform, an SRE can define the desired state of an EC2 instance, including its size, operating system, security groups, and storage, and Terraform will automatically create or modify the infrastructure to match that definition.
- Configuration Management: Configuration management tools like Ansible or Chef are used to automate the configuration of servers, ensuring consistent software installations, settings, and updates across the infrastructure. For example, an Ansible playbook can be written to install a specific version of a web server and configure its settings across a fleet of servers.
- Network Configuration: IaC can be applied to network devices and configurations, allowing for the automation of network setup and management. Tools like Cisco’s Network Automation tools or even using tools like Terraform with network provider plugins can automate the creation and configuration of virtual networks, firewalls, and load balancers.
- Database Management: IaC can manage database deployments, schema migrations, and backups. Tools such as Flyway or Liquibase can be integrated into the IaC process to handle database schema changes automatically during deployments.
Designing a Process for Automating Deployments and Rollbacks
An automated deployment and rollback process is crucial for maintaining system availability and minimizing downtime. This process typically involves several key stages.
- Version Control and Code Management: All infrastructure code, configuration files, and application code are stored in a version control system (e.g., Git). This allows for tracking changes, collaboration, and the ability to revert to previous versions if needed.
- Continuous Integration (CI): CI pipelines automatically build, test, and package application code. This ensures that code changes are validated before deployment.
- Automated Testing: Automated tests, including unit tests, integration tests, and end-to-end tests, are run as part of the CI/CD pipeline to verify the functionality and performance of the application.
- Deployment Automation: Deployment automation tools (e.g., Jenkins, GitLab CI, CircleCI, Spinnaker) orchestrate the deployment process. This includes deploying application code, configuring infrastructure, and running database migrations. Deployments can be triggered automatically upon successful CI builds or manually.
- Canary Deployments or Blue/Green Deployments: Strategies like canary deployments (gradually rolling out changes to a small subset of users) or blue/green deployments (deploying to a separate environment and then switching traffic) minimize the impact of potential issues.
- Monitoring and Alerting: Comprehensive monitoring and alerting systems are in place to detect any issues during deployment. If problems are detected, the system should automatically trigger a rollback.
- Automated Rollbacks: Rollback procedures are automated to quickly revert to the previous stable version of the application or infrastructure in case of deployment failures or performance degradation.
An effective deployment process often leverages a combination of these strategies, tailoring the approach to the specific needs of the application and infrastructure. For example, a microservices-based application might use canary deployments for each service, while a monolithic application might use a blue/green deployment strategy.
Tools Used for Automation
Various tools are used to automate different aspects of SRE tasks. The following table showcases some of the most popular and widely used tools in the industry:
| Category | Tool | Description |
|---|---|---|
| Infrastructure as Code (IaC) | Terraform | An open-source IaC tool for building, changing, and versioning infrastructure safely and efficiently. It supports a wide range of cloud providers and services. |
| Configuration Management | Ansible | An open-source automation engine that automates software provisioning, configuration management, and application deployment. It uses simple YAML files to define automation tasks. |
| Configuration Management | Chef | A powerful automation platform that transforms infrastructure into code. It uses Ruby-based recipes to define the desired state of systems. |
| Continuous Integration/Continuous Delivery (CI/CD) | Jenkins | An open-source automation server that helps automate the non-human part of the software development process, with a focus on CI/CD. |
| Continuous Integration/Continuous Delivery (CI/CD) | GitLab CI | A built-in CI/CD tool within the GitLab platform that automates the build, test, and deployment processes. |
| Continuous Integration/Continuous Delivery (CI/CD) | CircleCI | A cloud-based CI/CD platform that automates software builds, tests, and deployments. |
| Continuous Integration/Continuous Delivery (CI/CD) | Spinnaker | An open-source, multi-cloud continuous delivery platform for releasing software changes rapidly and reliably. |
| Container Orchestration | Kubernetes | An open-source system for automating deployment, scaling, and management of containerized applications. |
| Container Orchestration | Docker Compose | A tool for defining and running multi-container Docker applications. |
| Monitoring and Alerting | Prometheus | An open-source monitoring system and time series database. |
| Monitoring and Alerting | Grafana | A multi-platform open-source analytics and interactive visualization web application. |
| Monitoring and Alerting | PagerDuty | A platform for incident management and on-call scheduling. |
| Version Control | Git | A distributed version control system for tracking changes in source code during software development. |
Incident Management and Postmortems
Incident management and postmortems are crucial components of SRE, playing a vital role in maintaining system reliability and preventing future outages. Effective incident management minimizes the impact of incidents, while thorough postmortems identify root causes and drive improvements to prevent recurrence. This section will delve into the SRE approach to these critical practices.
The Process of Incident Management Within SRE
Incident management within SRE is a structured process designed to quickly detect, respond to, mitigate, and learn from incidents. It focuses on minimizing the impact on users and preventing future occurrences. The process typically involves several key stages.
- Detection: This involves identifying an incident, often through automated monitoring and alerting systems. Proactive monitoring, configured to detect anomalies and deviations from established performance indicators, is critical.
- Assessment and Triage: Once an incident is detected, it’s assessed to understand its severity, scope, and impact. This includes determining the urgency and prioritizing the response based on the affected users and services.
- Response and Mitigation: This stage involves taking immediate action to mitigate the impact of the incident. This may include rolling back deployments, scaling resources, or applying temporary fixes. The goal is to restore service availability as quickly as possible.
- Communication: Clear and timely communication is essential throughout the incident lifecycle. This involves informing stakeholders, including users, management, and other teams, about the incident’s status, impact, and expected resolution time.
- Coordination: Coordinating efforts among different teams, such as development, operations, and security, is crucial for effective incident resolution. Establishing clear roles and responsibilities helps streamline the process.
- Resolution: Once the mitigation steps have been taken, the team works to resolve the underlying cause of the incident. This may involve debugging code, fixing configuration errors, or addressing infrastructure issues.
- Postmortem and Learning: After the incident is resolved, a postmortem analysis is conducted to identify the root cause, contributing factors, and areas for improvement. This learning is crucial for preventing future incidents.
Best Practices for Conducting Postmortem Analyses
Conducting effective postmortem analyses is essential for learning from incidents and improving system reliability. Postmortems should be blameless, focusing on system failures rather than individual mistakes.
- Blameless Postmortems: The primary goal is to understandwhy* the incident happened, not to assign blame. This encourages a culture of learning and prevents individuals from being afraid to report incidents.
- Timeliness: Postmortems should be conducted as soon as possible after the incident is resolved, while the details are still fresh in everyone’s minds. This helps to maintain accuracy and prevent information loss.
- Inclusivity: Involve all relevant stakeholders in the postmortem, including engineers, product managers, and anyone else who was affected by the incident. This ensures a comprehensive understanding of the incident.
- Focus on Root Cause: Identify the underlying causes of the incident, not just the symptoms. Use techniques like the “5 Whys” to drill down to the root cause.
- Actionable Recommendations: The postmortem should result in a set of concrete, actionable recommendations to prevent future incidents. These recommendations should be specific, measurable, achievable, relevant, and time-bound (SMART).
- Documentation: Thoroughly document the incident, including the timeline, impact, root cause, and recommendations. This documentation serves as a valuable reference for future incidents.
- Dissemination: Share the postmortem report with the entire team and, where appropriate, with other stakeholders. This promotes transparency and helps to share lessons learned.
Preventing Future Incidents Based on Postmortem Findings
Postmortem findings are not useful unless they lead to concrete actions that prevent similar incidents from happening again. The recommendations from postmortems should be prioritized and implemented to improve system reliability.
- Prioritize Recommendations: Not all recommendations are created equal. Prioritize recommendations based on their potential impact and the effort required to implement them.
- Track Action Items: Assign owners and deadlines for each action item. Track the progress of these action items to ensure they are completed.
- Implement Changes: Implement the changes recommended in the postmortem. This may involve updating code, modifying infrastructure, or changing processes.
- Monitor Effectiveness: After implementing changes, monitor their effectiveness. Use metrics and monitoring tools to ensure that the changes have the desired impact.
- Iterate and Improve: Incident management and postmortems are iterative processes. Continuously review and improve the process based on experience and feedback.
Template for a Comprehensive Postmortem Report
A well-structured postmortem report provides a clear and concise summary of the incident, its impact, and the lessons learned. The following template provides a framework for creating a comprehensive postmortem report.
| Section | Description |
|---|---|
| Incident Summary | A brief overview of the incident, including the date, time, and duration. |
| Impact | A description of the impact of the incident, including the number of affected users, services, and revenue loss (if applicable). |
| Timeline | A detailed timeline of the incident, including key events and actions taken. |
| Root Cause | The identified root cause(s) of the incident. |
| Contributing Factors | Factors that contributed to the incident, such as design flaws, configuration errors, or human error. |
| Detection and Alerting | How the incident was detected and the effectiveness of the alerting systems. |
| Resolution | The steps taken to resolve the incident, including any workarounds or temporary fixes. |
| Action Items | A list of actionable recommendations to prevent future incidents, including the owner, deadline, and status. |
| Lessons Learned | A summary of the key lessons learned from the incident. |
| Appendix (Optional) | Supporting documentation, such as log files, graphs, and screenshots. |
Capacity Planning and Performance Optimization
? - DevOpsSchool.com")
Capacity planning and performance optimization are critical components of SRE, ensuring that systems can handle current and future workloads while maintaining optimal performance. These practices proactively address resource allocation and system efficiency, preventing outages and ensuring a positive user experience. Effective capacity planning allows organizations to anticipate growth and scale their infrastructure accordingly, while performance optimization focuses on fine-tuning existing systems for peak efficiency.
Importance of Capacity Planning
Capacity planning is a proactive process that anticipates future resource needs based on projected growth and changing workloads. It’s crucial for maintaining system stability, preventing performance degradation, and controlling costs. Without proper capacity planning, systems can become overwhelmed, leading to slow response times, service disruptions, and ultimately, user dissatisfaction.
Strategies for Optimizing System Performance
Optimizing system performance involves a multi-faceted approach, focusing on various areas to improve efficiency and responsiveness. This includes optimizing code, database queries, and infrastructure configurations.
- Code Optimization: Reviewing and refactoring code to eliminate inefficiencies, such as unnecessary loops or redundant calculations. Profiling tools can help identify performance bottlenecks within the code. For example, a slow-running function can be optimized by using more efficient algorithms or data structures.
- Database Optimization: Optimizing database queries by indexing frequently accessed columns, rewriting inefficient queries, and caching frequently accessed data. Database tuning involves adjusting database server configurations for optimal performance.
- Caching: Implementing caching mechanisms at various levels (e.g., browser caching, content delivery networks (CDNs), application-level caching) to reduce the load on servers and speed up content delivery. For example, a popular e-commerce site might cache product catalog data to reduce database load.
- Load Balancing: Distributing traffic across multiple servers to prevent any single server from being overwhelmed. Load balancers can also provide high availability by automatically redirecting traffic away from unhealthy servers.
- Network Optimization: Optimizing network configurations, such as using content delivery networks (CDNs) and reducing latency. For instance, choosing a CDN closer to the user can significantly reduce content loading times.
- Monitoring and Alerting: Continuously monitoring system performance metrics (e.g., CPU usage, memory utilization, response times) and setting up alerts to proactively identify and address performance issues.
Identifying and Resolving Performance Bottlenecks
Identifying and resolving performance bottlenecks is an iterative process that involves monitoring, analysis, and targeted improvements. The process often involves a cycle of observation, diagnosis, and remediation.
- Monitoring: Continuously monitor key performance indicators (KPIs) like response times, error rates, and resource utilization. Tools like Prometheus, Grafana, and Datadog are commonly used for monitoring and visualization.
- Profiling: Use profiling tools to identify performance bottlenecks within the application code. These tools provide insights into which functions or methods are consuming the most resources.
- Analyzing Logs: Analyze system and application logs to identify errors, slow queries, and other issues that may be contributing to performance problems.
- Testing: Conduct performance tests, such as load tests and stress tests, to simulate real-world traffic and identify performance limitations.
- Remediation: Implement targeted solutions to address identified bottlenecks. This may involve code optimization, database tuning, infrastructure scaling, or other improvements.
For example, if monitoring reveals consistently high CPU usage on a particular server, further investigation using profiling tools might reveal that a specific function within the application code is the culprit. The SRE team can then optimize that function, reducing CPU load and improving overall performance.
Techniques for Scaling Applications
Scaling applications involves increasing their capacity to handle growing workloads. This can be achieved through various techniques, depending on the application’s architecture and requirements.
- Vertical Scaling: Increasing the resources (e.g., CPU, memory) of a single server. This is often the simplest approach but has limitations, as there is a practical limit to how much resources a single server can have.
- Horizontal Scaling: Adding more servers to the infrastructure and distributing the workload across them. This is generally a more scalable approach and can handle large increases in traffic.
- Load Balancing: Distributing traffic across multiple servers to prevent any single server from being overloaded. Load balancers can also provide high availability by automatically redirecting traffic away from unhealthy servers.
- Caching: Implementing caching mechanisms to reduce the load on servers and speed up content delivery. Caching can be implemented at various levels, including the browser, content delivery networks (CDNs), and application-level caching.
- Database Optimization: Optimizing database queries and scaling the database infrastructure. This can involve techniques such as indexing, query optimization, and database sharding.
- Microservices Architecture: Breaking down a monolithic application into smaller, independent services. This allows for independent scaling of individual services based on their specific needs.
- Containerization: Using containerization technologies like Docker to package and deploy applications, making them easier to scale and manage.
- Autoscaling: Automatically adjusting the number of servers based on real-time demand. Cloud providers offer autoscaling features that can dynamically add or remove servers based on predefined metrics.
Release Engineering and Change Management
?")
Release engineering and change management are critical components of SRE, ensuring that software releases are deployed smoothly and that changes to production systems are managed with minimal disruption. These practices are essential for maintaining system stability, reliability, and the ability to deliver new features and improvements to users quickly and safely. Effective release engineering and change management practices are integral to achieving the goals of SRE.
The Role of Release Engineering in SRE
Release engineering plays a pivotal role in SRE by streamlining the software release process. It bridges the gap between development and operations, ensuring that code changes are packaged, tested, and deployed reliably.
- Automation: Automates build, testing, and deployment processes to reduce manual errors and accelerate release cycles. This includes automating tasks such as code compilation, running unit and integration tests, and deploying artifacts to various environments.
- Version Control: Manages and tracks different versions of software and its dependencies, ensuring consistency and the ability to roll back to previous states if necessary. This involves using version control systems like Git to manage code repositories, track changes, and facilitate collaboration among developers.
- Release Pipelines: Creates and maintains release pipelines that define the steps involved in a software release, from code commit to production deployment. These pipelines typically include stages for building, testing, staging, and deploying code.
- Deployment Strategies: Implements various deployment strategies (e.g., blue/green deployments, canary releases) to minimize the risk associated with software releases. These strategies help to reduce downtime and allow for easier rollback if issues arise.
- Environment Management: Manages different environments (e.g., development, staging, production) and ensures consistency across them. This includes provisioning infrastructure, configuring servers, and deploying applications to each environment.
Comparing Different Change Management Strategies
Several change management strategies can be employed to control and monitor changes to production systems. Each strategy has its own advantages and disadvantages, making it crucial to select the most appropriate one based on the specific context.
- Waterfall: This is a linear, sequential approach where each phase of the change process must be completed before moving on to the next. It’s a more traditional approach and can be suitable for well-defined, low-risk changes. However, it can be less flexible and slower than other approaches.
- Agile: Agile change management emphasizes iterative development, collaboration, and rapid feedback. Changes are implemented in short cycles (sprints), with frequent testing and deployment. This approach allows for greater flexibility and faster response to changing requirements, but it requires a high degree of automation and collaboration.
- ITIL (Information Technology Infrastructure Library): ITIL provides a framework for managing IT services, including change management. It focuses on standardization, documentation, and structured processes. It can be useful for complex changes and for organizations that need to comply with specific regulations.
- DevOps: DevOps integrates development and operations teams, promoting collaboration and automation throughout the software development lifecycle. Change management in DevOps often involves continuous integration and continuous delivery (CI/CD) pipelines, which automate the build, test, and deployment processes. This approach allows for rapid and frequent releases.
Designing a Process for Managing Changes to Production Systems
A well-designed change management process is essential for mitigating risks and ensuring the stability of production systems. The process should include clear steps, roles, and responsibilities.
- Change Request Submission: All changes should begin with a formal change request, detailing the proposed change, its purpose, potential impact, and a rollback plan.
- Change Assessment and Approval: The change request is assessed by a change advisory board (CAB) or designated individuals. The assessment should consider the risk, impact, and required resources. If approved, the change can proceed.
- Planning and Implementation: The change is planned, including defining the scope, schedule, and resources required. Implementation involves following the approved plan and documenting all actions.
- Testing and Validation: Thorough testing is conducted in non-production environments to validate the change. This includes unit tests, integration tests, and user acceptance testing (UAT).
- Deployment: The change is deployed to production, using a pre-defined deployment strategy (e.g., blue/green, canary). Monitoring is implemented to track performance and identify any issues.
- Post-Implementation Review: After deployment, a post-implementation review is conducted to evaluate the success of the change, identify any lessons learned, and update the change management process if necessary.
- Documentation: Throughout the process, comprehensive documentation is essential. This includes change requests, implementation plans, test results, and any issues encountered.
Detailing the Steps Involved in a Successful Software Release
A successful software release requires careful planning, execution, and monitoring. Each step must be executed with precision to minimize risks and ensure a smooth transition to production.
- Planning: Define the scope of the release, including the features, bug fixes, and performance improvements. Create a detailed release plan that includes timelines, resource allocation, and rollback strategies.
- Code Freeze: Freeze the code repository to prevent further changes during the release process. This ensures that the released version is stable and well-defined.
- Build and Testing: Build the software and run comprehensive tests, including unit tests, integration tests, and performance tests. Any issues must be addressed before proceeding.
- Staging: Deploy the release candidate to a staging environment that closely mirrors the production environment. Conduct final testing and validation.
- Deployment Strategy: Choose an appropriate deployment strategy (e.g., blue/green, canary) to minimize downtime and risk.
- Deployment Execution: Deploy the software to production, following the pre-defined deployment strategy. Monitor the deployment process and address any issues immediately.
- Monitoring and Validation: Continuously monitor the application’s performance and health after deployment. Verify that all features are working as expected.
- Rollback Plan: Have a detailed rollback plan in place in case of issues. This plan should include steps for reverting to the previous version.
- Communication: Communicate the release progress to stakeholders, including developers, operations teams, and users.
- Post-Release Review: Conduct a post-release review to evaluate the success of the release, identify lessons learned, and update the release process for future releases.
SRE vs. Traditional Operations
The shift from traditional IT operations to Site Reliability Engineering (SRE) represents a significant evolution in how organizations approach software development, deployment, and maintenance. This transition involves not just adopting new tools and technologies, but also fundamentally changing the culture and mindset within the IT and development teams. Understanding the differences between these two approaches is crucial for organizations considering implementing SRE practices.
Comparing SRE and Traditional IT Operations
Traditional IT operations often focus on maintaining system uptime and stability through manual processes and reactive troubleshooting. SRE, on the other hand, emphasizes automation, proactive monitoring, and a deep understanding of the software development lifecycle. This comparison highlights key differences:
| Aspect | Traditional IT Operations | SRE |
|---|---|---|
| Primary Goal | Maintain uptime and stability. | Ensure system reliability and balance it with the rate of innovation. |
| Focus | Reactive incident response and manual processes. | Proactive monitoring, automation, and continuous improvement. |
| Culture | Siloed teams with a separation between development and operations. | Collaborative, with shared responsibility between development and operations. |
| Tooling | Often relies on legacy tools and manual scripting. | Leverages automation tools, monitoring systems, and infrastructure-as-code. |
| Metrics | Focuses on system-level metrics (e.g., CPU usage, memory). | Uses Service Level Objectives (SLOs), Service Level Indicators (SLIs), and error budgets to measure and manage reliability. |
| Deployment Frequency | Infrequent, with manual deployments. | Frequent, automated deployments with continuous integration and continuous delivery (CI/CD) pipelines. |
| Error Handling | Manual troubleshooting and incident response. | Automated alerting, automated remediation, and postmortem analysis. |
| On-Call | Often a stressful and reactive process. | A more structured and proactive process, with a focus on blameless postmortems and continuous learning. |
Benefits of Adopting SRE Practices
Adopting SRE practices offers numerous benefits for organizations seeking to improve the reliability, scalability, and efficiency of their systems. These advantages contribute to a more robust and resilient infrastructure.
- Improved Reliability: SRE practices, such as SLOs and error budgets, ensure a clear focus on system reliability, leading to fewer outages and improved user experience. For instance, companies like Google, where SRE originated, have demonstrated significantly higher uptime rates compared to those using traditional operations models.
- Faster Innovation: By automating operational tasks and reducing the burden on operations teams, SRE frees up development resources to focus on building new features and iterating quickly. This leads to a faster time-to-market for new products and services.
- Increased Efficiency: Automation and infrastructure-as-code reduce manual errors and improve operational efficiency. This allows organizations to scale their systems more easily and efficiently.
- Reduced Costs: Proactive monitoring, automated remediation, and efficient resource utilization help to reduce operational costs. This includes lower costs related to downtime and manual troubleshooting.
- Enhanced Collaboration: SRE fosters a culture of collaboration between development and operations teams, leading to better communication and shared responsibility. This can reduce the “us vs. them” mentality that often exists in traditional IT organizations.
- Data-Driven Decision Making: SRE relies on data and metrics to make informed decisions about system design, deployment strategies, and resource allocation. This data-driven approach leads to more effective problem-solving and continuous improvement.
Cultural Shifts Required for Implementing SRE
Implementing SRE requires a significant cultural shift within an organization. It’s not just about adopting new tools; it’s about changing the way teams work together and approach problem-solving. This shift often involves breaking down silos and promoting a culture of shared responsibility.
- Collaboration and Communication: SRE emphasizes the importance of collaboration between development, operations, and other teams. This requires open communication channels, shared goals, and a willingness to learn from each other.
- Shared Ownership: SRE promotes shared ownership of systems and services. Development teams take more responsibility for the operational aspects of their code, and operations teams become more involved in the development process.
- Blameless Postmortems: Blameless postmortems are essential for learning from incidents without assigning blame. This creates a safe environment for teams to analyze root causes and implement preventative measures. The focus is on system improvement rather than individual accountability.
- Automation and Efficiency: SRE teams are encouraged to automate repetitive tasks and streamline processes. This frees up time for more strategic work and reduces the risk of human error.
- Data-Driven Decision Making: Decisions should be based on data and metrics, such as SLOs, SLIs, and error budgets. This requires establishing robust monitoring systems and a culture of data analysis.
- Embracing Failure: Failure is seen as an opportunity to learn and improve. The use of error budgets allows teams to experiment and innovate while still maintaining a certain level of reliability.
Tools and Technologies for SRE
Site Reliability Engineering (SRE) teams rely on a diverse set of tools and technologies to manage complex systems, automate tasks, monitor performance, and respond to incidents effectively. Selecting the right tools is crucial for SRE success. This section will explore the essential tools, how to choose them, demonstrate their use, and Artikel the technologies utilized for logging and tracing.
Essential Tools for SRE Teams
SRE teams use a variety of tools to manage their responsibilities. These tools are categorized by function, including monitoring, alerting, incident management, automation, and more. The following list provides an overview of essential tools in each category.
- Monitoring Tools: These tools collect and analyze data about system performance. Examples include:
- Prometheus: An open-source monitoring and alerting toolkit. It excels at collecting metrics from services and applications.
- Grafana: A data visualization and dashboarding tool often used with Prometheus to display metrics and create insightful dashboards.
- Datadog: A comprehensive monitoring and analytics platform offering a wide range of features, including infrastructure monitoring, application performance monitoring (APM), and log management.
- New Relic: Another comprehensive APM and monitoring platform with similar capabilities to Datadog.
- Alerting Tools: These tools notify SREs of critical events. Examples include:
- PagerDuty: A popular incident management platform that provides on-call scheduling, alerting, and incident tracking.
- VictorOps (now Splunk On-Call): A similar incident management platform with features for collaboration and automation.
- Alertmanager (Prometheus): An alerting component of Prometheus that handles alert notifications.
- Incident Management Tools: These tools help manage incidents, track progress, and facilitate postmortems. Examples include:
- Jira Service Management: A service desk and incident management tool that allows for tracking incidents, managing on-call rotations, and creating postmortems.
- Opsgenie (Atlassian): Another incident management platform providing on-call scheduling, alerting, and incident response capabilities.
- Automation Tools: These tools automate repetitive tasks and infrastructure provisioning. Examples include:
- Ansible: An open-source automation engine for configuration management, application deployment, and task automation.
- Terraform: An infrastructure-as-code tool for building, changing, and versioning infrastructure safely and efficiently.
- Chef: A configuration management tool that helps automate infrastructure configuration.
- Puppet: Similar to Chef, Puppet is a configuration management tool that automates infrastructure management.
- Logging and Tracing Tools: These tools help collect, analyze, and visualize logs and traces for troubleshooting and performance analysis. Examples include:
- Elasticsearch, Logstash, and Kibana (ELK Stack): A popular open-source stack for log aggregation, processing, and visualization.
- Splunk: A powerful log management and analytics platform.
- Jaeger: An open-source distributed tracing system.
- Zipkin: Another open-source distributed tracing system.
- Version Control Tools: Used for managing code and infrastructure-as-code configurations.
- Git: A distributed version control system.
- GitHub, GitLab, Bitbucket: Platforms that host Git repositories and provide collaboration features.
Choosing the Right Tools for Specific Tasks
Selecting the appropriate tools involves careful consideration of specific needs and requirements. Several factors influence this decision-making process.
- Team Expertise: Choose tools that your team is familiar with or can quickly learn. Training and onboarding costs should be factored into the decision.
- System Architecture: Consider the architecture of your systems. Some tools are better suited for specific architectures (e.g., microservices, monolithic applications).
- Scalability and Performance: Ensure the tools can handle the scale of your infrastructure and provide the necessary performance.
- Integration Capabilities: The chosen tools should integrate well with other tools in your ecosystem.
- Cost: Evaluate the cost of the tools, including licensing fees, maintenance costs, and potential hidden costs. Consider both open-source and commercial options.
- Features and Functionality: Assess the features and functionality of each tool to determine if it meets your specific needs.
Demonstrating the Use of Tools in Real-World Scenarios
To illustrate how these tools are used, consider a scenario involving a web application experiencing slow response times. SREs would use a combination of tools to diagnose and resolve the issue.
- Monitoring: Prometheus collects metrics such as response times, error rates, and resource utilization from the application. Grafana is used to visualize these metrics on a dashboard, showing a spike in response times.
- Alerting: An alert is triggered in Prometheus based on a predefined threshold (e.g., response time exceeding 3 seconds). This alert is then sent to PagerDuty, which notifies the on-call SRE.
- Tracing: Jaeger is used to trace requests through the application, pinpointing the specific service or component causing the delay. This provides detailed information about the path of a request and the time spent in each part of the system.
- Logging: The ELK stack (Elasticsearch, Logstash, and Kibana) is used to analyze application logs. SREs search the logs for errors, warnings, and other relevant information that might provide clues about the root cause.
- Incident Management: The SRE uses Jira Service Management to create an incident, document the steps taken to resolve the issue, and facilitate a postmortem.
- Automation: Ansible is used to deploy a fix to the affected component or service, potentially scaling up resources.
This combination of tools allows SREs to quickly identify, diagnose, and resolve the performance issue.
Technologies Used for Logging and Tracing
Logging and tracing are essential for understanding system behavior and troubleshooting issues. Several technologies are commonly used for these purposes.
- Logging Technologies:
- Log Aggregation: Systems like the ELK stack (Elasticsearch, Logstash, and Kibana) and Splunk are used to collect, aggregate, and store logs from various sources.
- Log Parsing and Processing: Logstash (ELK) and Splunk provide capabilities for parsing logs, extracting relevant data, and transforming them into a structured format.
- Log Analysis: Elasticsearch and Splunk offer powerful search and analysis capabilities for identifying patterns, anomalies, and errors within the logs.
- Log Visualization: Kibana (ELK) and Splunk provide dashboards and visualizations for exploring and understanding log data.
- Tracing Technologies:
- Distributed Tracing Systems: Jaeger and Zipkin are popular open-source distributed tracing systems that track requests as they traverse multiple services in a distributed system.
- Instrumentation Libraries: Libraries such as OpenTracing and OpenTelemetry provide APIs for instrumenting code and propagating trace context across service boundaries.
- Trace Context Propagation: Technologies like HTTP headers and gRPC metadata are used to propagate trace context between services.
- Data Storage and Visualization: Traces are typically stored in a distributed tracing system’s backend, and visualization tools provide insights into request flows, latency, and dependencies.
SRE in Different Environments
Site Reliability Engineering (SRE) principles are adaptable and applicable across a wide range of technological environments. The core tenets of SRE – automation, monitoring, incident response, and continuous improvement – remain consistent. However, the specific implementation and focus areas of SRE teams often shift depending on the infrastructure, industry, and organizational structure. This section explores how SRE adapts to different environments, provides examples of its implementation across various industries, and addresses the challenges encountered in large organizations.
Adapting SRE Practices to Different Environments
SRE practices are not one-size-fits-all. Their successful application depends on tailoring them to the specific environment. Key adaptations include:
- Cloud Environments: In cloud environments (AWS, Azure, GCP), SRE teams leverage the cloud provider’s services extensively. This includes using managed services for databases, monitoring, and logging. Automation becomes paramount, with Infrastructure as Code (IaC) playing a critical role in managing resources. The focus is often on optimizing cloud resource utilization, cost management, and leveraging autoscaling features.
- On-Premise Environments: On-premise environments require a different approach. SRE teams often deal with more manual tasks, such as server provisioning and maintenance. Automation is still crucial, but it might involve using tools like Ansible or Chef for configuration management. Monitoring may involve setting up and managing their own monitoring tools, and the focus is often on maximizing the uptime and performance of the existing infrastructure.
- Hybrid Environments: Hybrid environments, combining on-premise and cloud resources, present unique challenges. SRE teams must manage the complexities of integrating and orchestrating resources across different platforms. Consistent monitoring, standardized automation practices, and robust network connectivity are essential.
- Edge Computing: As edge computing becomes more prevalent, SRE must adapt to managing distributed systems at the edge of the network. This involves considerations like limited bandwidth, intermittent connectivity, and the need for local data processing. Automation, monitoring, and incident response strategies must be designed to handle these constraints.
SRE Implementation in Different Industries
SRE implementation varies significantly across industries, driven by their unique requirements and priorities.
- E-commerce: In e-commerce, SRE teams prioritize high availability, low latency, and seamless user experience. They focus on handling peak traffic during sales events, optimizing checkout processes, and ensuring rapid incident response.
- Financial Services: Financial institutions demand robust security, compliance, and high availability. SRE teams in this industry focus on risk mitigation, fraud detection, and ensuring the integrity of financial transactions. Strict change management processes and adherence to regulatory requirements are crucial.
- Healthcare: Healthcare organizations rely on SRE to ensure the availability and security of critical systems, such as electronic health records (EHRs) and patient monitoring systems. Data privacy and compliance with regulations like HIPAA are paramount.
- Gaming: The gaming industry requires SRE to manage massive player bases, handle real-time interactions, and prevent cheating. They focus on optimizing game servers, ensuring low latency for players, and providing a stable and engaging gaming experience.
- Manufacturing: SRE in manufacturing focuses on the reliability of industrial control systems (ICS) and the availability of critical manufacturing processes. They prioritize uptime, data integrity, and the security of connected devices.
Challenges of Implementing SRE in Large Organizations
Implementing SRE in large organizations can be complex due to various factors.
- Organizational Silos: Large organizations often have distinct teams (development, operations, security) that may not collaborate effectively. SRE requires breaking down these silos and fostering a culture of shared responsibility.
- Legacy Systems: Large organizations often rely on legacy systems that can be difficult to integrate with modern SRE practices. This can require gradual modernization efforts and careful planning.
- Resistance to Change: Implementing SRE involves significant changes to existing processes and workflows. Resistance from individuals or teams accustomed to traditional operational practices is common.
- Scale and Complexity: Managing infrastructure and applications at scale in large organizations presents significant challenges. SRE teams must design and implement robust automation, monitoring, and incident response strategies to handle the complexity.
- Skills Gap: Finding and retaining SRE professionals with the necessary skills and experience can be challenging. Organizations may need to invest in training and development programs.
Comparison of SRE Implementation Strategies Across Different Environments
The following table compares SRE implementation strategies across cloud, on-premise, and hybrid environments.
| Aspect | Cloud Environment | On-Premise Environment | Hybrid Environment |
|---|---|---|---|
| Infrastructure Management | Leverages cloud provider’s managed services (e.g., databases, monitoring). Infrastructure as Code (IaC) is extensively used for automation and resource provisioning. | Manual provisioning and maintenance. Automation often involves tools like Ansible or Chef for configuration management. | Requires orchestration and integration of resources across cloud and on-premise environments. Consistent IaC and automation practices are essential. |
| Monitoring and Alerting | Utilizes cloud provider’s monitoring tools (e.g., CloudWatch, Azure Monitor, Stackdriver). Focus on optimizing cloud resource utilization and cost management. | Requires setting up and managing own monitoring tools (e.g., Prometheus, Grafana). Focus on maximizing uptime and performance of existing infrastructure. | Requires unified monitoring and alerting across both cloud and on-premise resources. Centralized logging and monitoring solutions are crucial. |
| Automation | Highly automated using IaC, CI/CD pipelines, and cloud provider’s services. Focus on autoscaling and automated deployments. | Automation often involves configuration management tools (e.g., Ansible, Chef). Focus on automating repetitive tasks and streamlining deployments. | Requires consistent automation practices across both cloud and on-premise environments. Automation must handle diverse infrastructure components. |
| Incident Response | Leverages cloud provider’s incident management tools and services. Focus on rapid incident detection and resolution. | Relies on internal incident management processes and tools. Focus on quickly restoring services and minimizing downtime. | Requires a unified incident response strategy that can handle incidents across both cloud and on-premise environments. Communication and coordination are key. |
| Key Focus Areas | Cost optimization, autoscaling, resource utilization, cloud security. | Uptime, performance, server maintenance, legacy system integration. | Connectivity, security, consistent monitoring, unified automation, interoperability. |
Conclusive Thoughts
? | Nordic APIs")
In conclusion, Site Reliability Engineering represents a paradigm shift in how we approach software operations. By embracing engineering principles, prioritizing automation, and fostering a culture of continuous improvement, organizations can build systems that are not only reliable but also adaptable and scalable. Understanding SRE is essential for anyone involved in software development, operations, or anyone who wants to ensure the health and stability of their digital services.
As technology continues to evolve, SRE will remain a crucial element in delivering exceptional user experiences and achieving business success.
Expert Answers
What is the primary goal of SRE?
The primary goal of SRE is to create and maintain reliable, scalable, and efficient software systems by applying software engineering principles to operations.
How does SRE differ from traditional IT operations?
SRE emphasizes automation, proactive monitoring, and a software engineering approach to operational tasks, whereas traditional IT operations often rely on manual processes and reactive troubleshooting.
What are error budgets, and why are they important?
Error budgets define the acceptable level of unreliability for a service over a specific period. They are crucial because they balance the need for innovation with the need for reliability, allowing teams to make informed decisions about risk and feature releases.
What skills are essential for an SRE?
Essential skills include strong programming abilities, system administration knowledge, experience with monitoring and alerting tools, understanding of cloud technologies, and excellent problem-solving skills.
How does SRE contribute to DevOps?
SRE practices are a key component of DevOps, as they provide a framework for automating operations, improving collaboration between development and operations teams, and ensuring continuous delivery of reliable software.